
AVGO Seasonality Through the Election Cycle
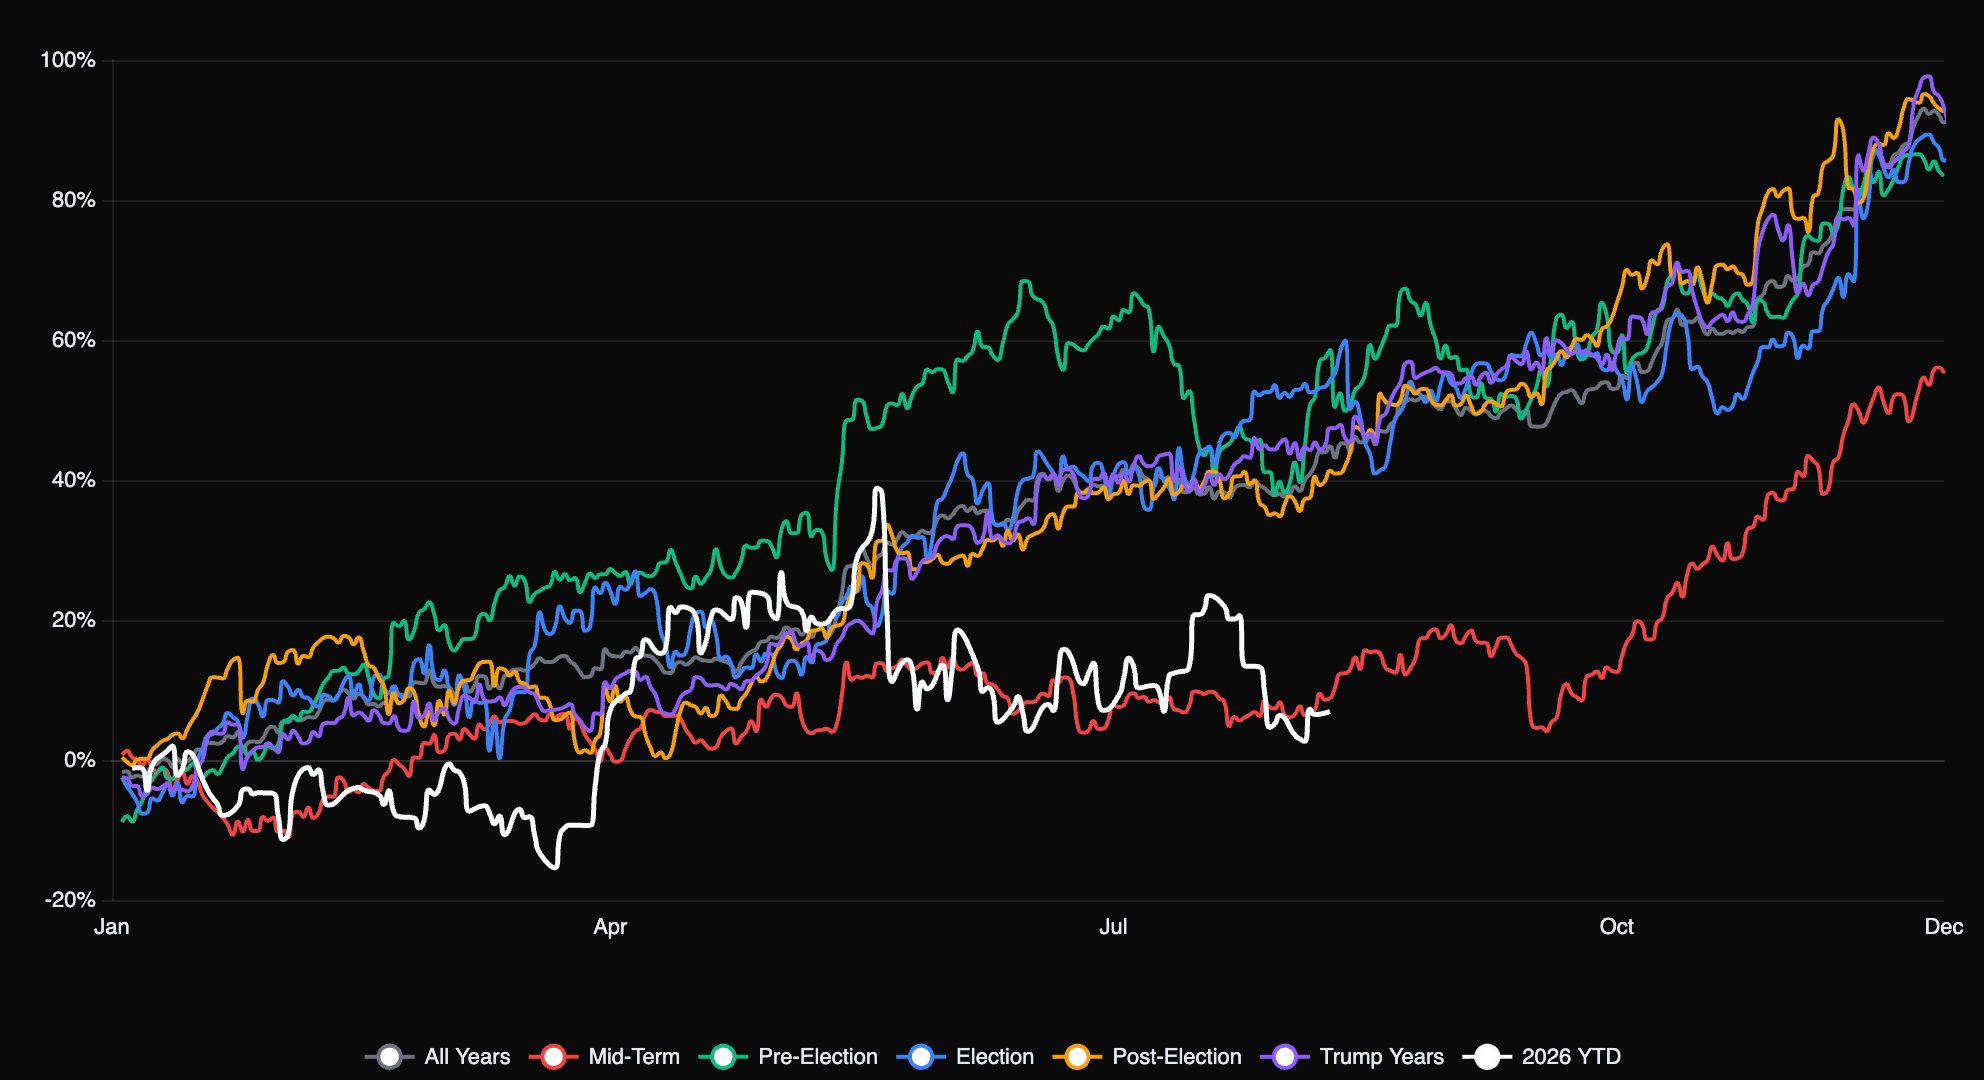
Broadcom Inc has traded publicly since 2010, giving us a 16-year sample to break down by the U.S. presidential election cycle. The data shows consistent seasonal patterns across different election-year profiles.
Reading the chart
The "All Years" line shows the average cumulative path across all valid years. The election-cycle profiles break those same years into groups by year type:
- Election — year % 4 == 0
- Post-Election — year % 4 == 1
- Mid-Term — year % 4 == 2
- Pre-Election — year % 4 == 3
- Trump Presidency Years — the defined Trump-administration years (2016–2019, 2024–2025)
- 2026 YTD — the direct cumulative return of the current year, so far
Open the explorer page and toggle each profile to compare.
Seasonal chart
Snapshot
| Price | $370.34 |
| Historical data range | 2010 – 2025 (16 years) |
| Current year | 2026 |
Profiles
| Profile | Range | Years |
|---|---|---|
| All Years | 2010 – 2025 | all 16 |
| Mid-Term | 2010 – 2022 | 2010, 2014, 2018, 2022 |
| Pre-Election | 2011 – 2023 | 2011, 2015, 2019, 2023 |
| Election | 2012 – 2024 | 2012, 2016, 2020, 2024 |
| Post-Election | 2013 – 2025 | 2013, 2017, 2021, 2025 |
| Trump Presidency Years | 2016 – 2025 | 2016, 2017, 2018, 2019, 2024, 2025 |
| 2026 YTD | 2026 | 2026 |
Monthly checkpoints
Cumulative % change from Jan 1, sampled at each month-end (the last two December rows are day 364, one day short of year-end).
| Month | All Years | Pre-Election | Election | Post-Election | Mid-Term | Trump Presidency Years | 2026 YTD |
|---|---|---|---|---|---|---|---|
| Jan | 3.1% | 0.7% | 6.2% | 11.1% | -8.1% | 1.9% | — |
| Feb | 9.3% | 19.9% | 9.0% | 8.6% | -1.2% | 4.2% | — |
| Mar | 14.8% | 25.7% | 22.0% | 5.8% | 6.5% | 7.3% | -10.8% |
| Apr | 14.1% | 27.1% | 19.9% | 6.3% | 1.6% | 10.6% | 20.3% |
| May | 28.8% | 48.9% | 22.5% | 27.9% | 12.0% | 18.7% | 32.6% |
| Jun | 35.5% | 64.1% | 38.5% | 32.2% | 7.0% | 33.9% | 6.6% |
| Jul | 38.2% | 56.6% | 37.2% | 37.9% | 7.3% | 39.9% | 12.4% |
| Aug | 44.8% | 58.6% | 54.3% | 41.3% | 8.8% | 47.4% | 6.9% |
| Sep | 49.9% | 53.8% | 56.7% | 49.8% | 16.8% | 54.8% | — |
| Oct | 56.8% | 57.9% | 54.1% | 69.6% | 19.8% | 63.3% | — |
| Nov | 69.2% | 64.5% | 61.1% | 81.7% | 38.6% | 76.4% | — |
| Dec* | 92.1% | 84.1% | 87.4% | 93.1% | 56.1% | 94.8% | — |
Highlights
- 2026 is running ahead of the historical pace. Through late April, AVGO is up +20.3%, above the ~14.1% average "All Years" cumulative gain at the same point. However, it trails the Pre-Election profile by about 6.8 percentage points.
- Post-Election years are the strongest profile, finishing near +93% cumulative by year-end, with Mid-Term years the laggard at +56%.
- Post-Election years show a sharp acceleration in Q4, climbing from ~70% in October to ~93% by year-end.
- 2026 saw a notable divergence in June, dropping from +32.6% in May to just +6.6% in June — a reversal not typical in most election-cycle profiles.
Caveats
This is historical statistics, not a forecast. Averages smooth over individual outlier years, so trade the summary above with that in mind. Full daily data is available on the explorer page.
Historical statistics based on available market data. Not financial advice. Source: Yahoo Finance